
Page 149 - Teaching Innovation for the 21st Century
P. 149
Data collection
The main purpose of the survey was to assess the students’ understanding of Design- Expert® after online training was provided by the course lecturer. Secondly, the survey served to examine whether students would be willing to use the software for future design of experiments. Finally, the survey would assist with determining what the lecturers could do to improve the training to achieve the goal of using Design-Expert®.
Of a total 43 students registered for the CELCHB3 module, only 33 students attended the training. Twenty students submitted responses to the survey. The survey questions are indicated with letters A to K for convenience, as shown in Table 1. Students were asked to tick the box that best represented their feelings, indicating whether they agree or disagree with each of the statements, as set out in Table 2. The statements explored participants’ understanding and willingness to use the software in future designs, using responses which vary from strongly disagree, disagree, somewhat agree and strongly agree, not applicable (N/A).
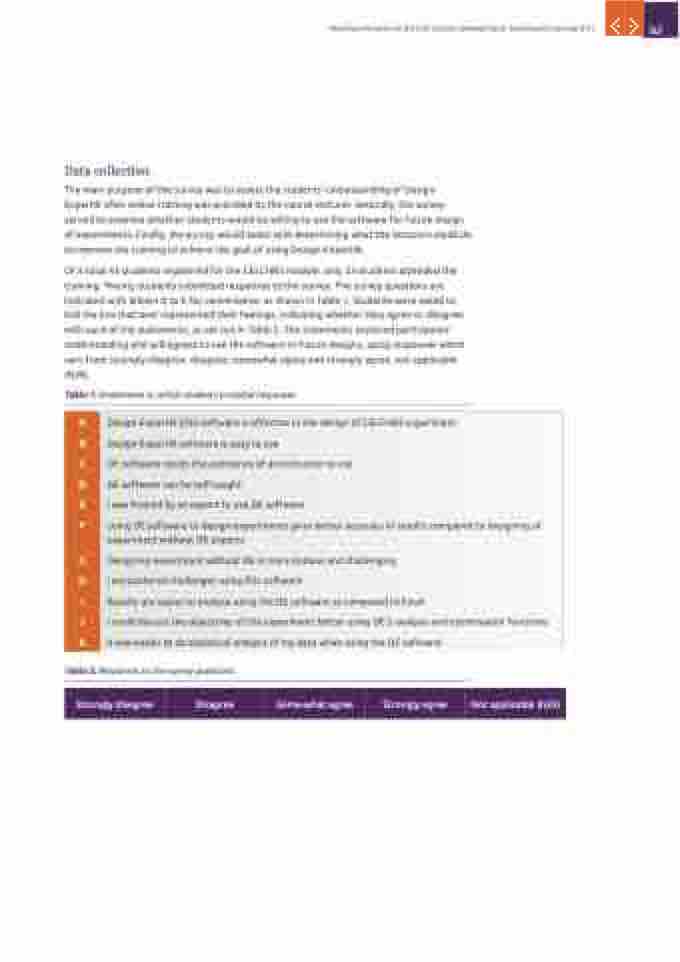
Table 1: Statements to which students provided responses
Teaching Innovation for the 21st Century | Showcasing UJ Teaching and Learning 2021
A
Design-Expert® (DE) software is effective in the design of CELCHB3 experiment Design-Expert® software is easy to use
DE software needs the assistance of an instructor to use
DE software can be self-taught
I was trained by an expert to use DE software
Using DE software to design experiments gives better accuracy of results compared to designing of experiment without DE experts
Designing experiment without DE is more tedious and challenging
I encountered challenges using this software
Results are easier to analyse using the DE software as compared to Excel
I could discuss the objectives of the experiment better using DE’s analysis and optimisation functions It was easier to do statistical analysis of my data when using the DE software
B
C
D
E
F
G
H
I
J
K
Table 2: Responses to the survey questions
Strongly disagree
Disagree
Some-what agree
Strongly agree
Not applicable (N/A)
147
